In this video, Mary Ellen spotlights the areas driving market momentum following Taiwan Semiconductor’s record-breaking earnings report. She analyzes continued strength in semiconductors, utilities, industrials, and AI-driven sectors, plus highlights new leadership in robotics and innovation-focused ETFs like ARK. From there, Mary Ellen breaks down weakness in health care and housing stocks, shows how to refine trade entries using hourly charts, and compares today’s rally to past market surges. Watch as she explores setups in silver and examines individual stocks like Nvidia, BlackRock, and State Street.
New videos from Mary Ellen premiere weekly on Fridays. You can view all previously recorded episodes at this link.
If you’re looking for stocks to invest in, be sure to check out the MEM Edge Report! This report gives you detailed information on the top sectors, industries and stocks so you can make informed investment decisions.
The stock market feels like it’s holding its breath ahead of Big Tech earnings. The first two days of the trading week were mostly quiet, but Tuesday gave us a few nuggets worth chewing on.
The S&P 500 ($SPX) squeaked out another record close, up by a modest +0.06%. It’s barely a blip, but it keeps the uptrend intact.
Tech momentum slowed down a tad, but we didn’t see a wave of selling. It was more like a little profit-taking after a strong run. No reason to hit the panic button just yet.
StockCharts Tip: Head to the Market Summary page and take a glance at the Market Factors panel. On Tuesday, Large-Cap Growth and Large-Cap Momentum were the only factors in the red (see image below).
FIGURE 1. MARKET FACTORS PANEL IN THE MARKET SUMMARY PAGE. Here you see the one-day performance metrics of the factors. You can change the timeframe using the dropdown menu at the top of the page. Image source: StockCharts.com. For educational purposes.
In the US Sectors panel in the Market Summary page, Technology was the lone S&P 500 sector that finished lower. Tuesday’s action can be seen in the StockCharts MarketCarpet of the S&P 500, based on a one-day performance.
FIGURE 2. MARKETCARPET FOR THE S&P 500. The Technology sector took a bit of a hit on Tuesday, but other sectors saw gains. Image source: StockCharts.com. For educational purposes.
The big names — NVIDIA (NVDA), Microsoft Corp. (MSFT), Amazon.com (AMZN), Meta Platforms (META), and Broadcom (AVGO) — were all in the laggard camp. This pause in tech stocks comes right before a wave of Big Tech earnings.
Some of the big tech companies reporting earnings this week are Alphabet, Inc. (GOOGL), Tesla, Inc. (TSLA), and International Business Machines (IBM). All three report on Wednesday after the close. If GOOGL and TSLA come in hot with solid numbers and upbeat guidance, the S&P 500 and Nasdaq Composite ($COMPQ) could catch a tailwind. (Fun fact: both stocks closed higher on Tuesday.)
Despite Tuesday’s tech wobble, major support levels are holding. The Nasdaq Composite remains comfortably above its 20-day exponential moving average (EMA), and breadth is improving (see chart below).
FIGURE 3. DAILY CHART OF THE NASDAQ COMPOSITE. The index is above its 20-day exponential moving average, and market breadth is improving. Chart source: StockCharts.com. For educational purposes.
Small Caps Still in the Game
We’re also seeing small-cap stocks rising. When small-caps participate in the market’s upside move, it’s an indication of a healthy stock market. Healthcare stocks represent a significant portion of the small-cap indexes, which explains why Health Care was the top-performing sector on Tuesday.
Another area that stole the spotlight was homebuilders. The SPDR S&P Homebuilders ETF (XHB) broke above its 200-day simple moving average (SMA), a positive sign for the struggling industry group (see chart below). Its Relative Strength Index (RSI) indicates that momentum is relatively strong.
FIGURE 4. SPDR S&P HOMEBUILDERS ETF (XHB). The ETF broke above its 200-day simple moving average, and momentum is relatively strong. XHB has underperformed SPY over the last year. Chart source: StockCharts.com. For educational purposes.
Over the last year, XHB has lagged the SPDR S&P 500 ETF (SPY) by roughly 18%. Strong earnings from DR Horton, Inc. (DHI) and PulteGroup, Inc. (PHM), however, have given the group a welcome boost, even with a soft housing backdrop. We’ll get the June Existing Home Sales data on Wednesday. A stronger-than-expected report could add fuel to XHB’s rally.
StockCharts Tip: The XHB chart above is part of the Market Summary ChartPack, which is free for StockCharts subscribers. Install it, and you’ll have a ready-to-use list of charts for days like this.
Also worth a peek is the U.S. Dow Jones Home Construction Index ($DJUSHB), which topped the Dow Industries list (check the US Industries panel in Market Summary and hit the Dow Industries tab).
Gold and Silver Nudge Higher
While tech cooled and home builders heated up, precious metals prices climbed higher. Gold ($GOLD) rose 0.92% and silver ($SILVER) gained 0.94%. Gold sits just under its all-time high, and silver is back to levels we haven’t seen since 2011.
The Big Picture: Still a Healthy Market Environment
None of Tuesday’s actions suggests a crack in the market’s growth story. We are in the thick of earnings season, and that always brings uncertainty and volatility. Expectations are high for Big Tech, especially in light of a weaker dollar. Stay patient, watch the price action, and let the charts guide your next move.
Disclaimer: This blog is for educational purposes only and should not be construed as financial advice. The ideas and strategies should never be used without first assessing your own personal and financial situation, or without consulting a financial professional.
Markets don’t usually hit record highs, risk falling into bearish territory, and spring back to new highs within six months. But that’s what happened in 2025.
In this special mid-year recap, Grayson Roze sits down with David Keller, CMT, to show how disciplined routines, price-based signals, and a calm process helped them ride the whipsaw instead of getting tossed by it. You’ll see what really happened under the surface, how investor psychology drove the swings, and the exact StockCharts tools they leaned on to stay objective.
If you’re focused on protecting capital, generating income, and sleeping well at night while still capturing the upside, this is a must-watch. Discover which charts deserve your attention now, what to ignore, and how to prep for the back half of 2025.
This video premiered on July 23, 2025. Click on the above image to watch on our dedicated Grayson Roze pageon StockCharts TV.
You can view previously recorded videos from Grayson at this link.
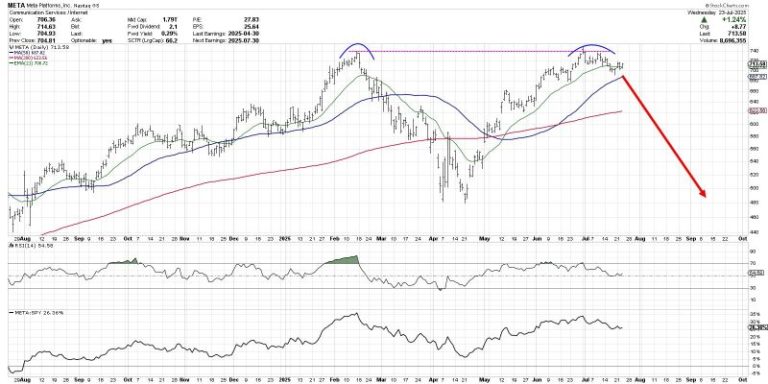
The chart of Meta Platforms, Inc. (META) has completed a roundtrip from the February high around $740 to the April low at $480 and all the way back again. Over the last couple weeks, META has now pulled back from its retest of all-time highs, leaving investors to wonder what may come next.
Is this the beginning of a new downtrend phase for META? Or just a brief pullback before a new uptrend phase propels META to new all-time highs?
Today we’ll look at two potential scenarios, including the double top pattern and the cup and handle pattern, and share which technical indicators and approaches could help us determine which path plays out into August.
The double top scenario basically means that the late July retest of the previous all-time high was the end of the recent uptrend phase. The double top pattern is literally when a major resistance level is set and then retested. The implication is that a lack of willing buyers means the uptrend is exhausted, and there is nowhere to go but down.
While the 21-day exponential moving average is currently in play for META, I would say that a break below the 50-day moving average could confirm this as the correct scenario. If that smoothing mechanism does not hold, then the price action would imply less of a pullback and more like the beginning of a real distribution phase.
What is META pulls back but then resumes an uptrend phase, leading META to another new all-time high? That would result in a confirmed cup and handle pattern, created by a large rounded bottoming pattern followed by a brief pullback. The key to this pattern is the “rim” of the cup, which sits right at $740 for META.
Given the pullback META has demonstrated so far in July, I would say that a break above the $740 level would basically confirm a bullish cup and handle pattern. That would suggest much more upside potential for META, as the stock would literally go into previously uncharted territory.
So how can we determine which scenario is more likely to play out? This is where we need to incorporate more technical indicators into the discussion, as a way to further validate and confirm our investment thesis.
Just to review, I think a break above $740 would confirm a bullish cup and handle pattern. I would also say that a break below the $680 level, which would represent a move below the 50-day moving average as well as the June swing lows, would basically confirm a bearish double top pattern.
We can also use the Relative Strength Index (RSI) to help determine whether META remains in a bullish trend phase. During bull phases, the RSI rarely gets below 40, because buyers usually step in to “buy the dips” and keep the momentum fairly constructive. So if the price would break down, and the RSI would not hold that crucial 40 level, that could mean a bearish outlook is warranted.
Finally, we can use volume-based indicators to assess whether moves in the price are supported by stronger volume readings. Here I’ve included the Accumulation/Distribution Line, which tracks the trend in daily volume readings over time. We can see that the high in July resulted in a divergence, as the A/D line was trending lower. If the A/D line would break below its June and July lows, marked by a dashed red line, that would represent a bearish volume reading for META.
Technical analysis is less about predicting the future, and more about determining the most probable scenarios based on our analysis of trend, momentum, and volume. I hope this discussion shows how the outlook for META can be easily determined and tracked using the best practices of technical analysis!
Disclaimer: This blog is for educational purposes only and should not be construed as financial advice. The ideas and strategies should never be used without first assessing your own personal and financial situation, or without consulting a financial professional.
The author does not have a position in mentioned securities at the time of publication. Any opinions expressed herein are solely those of the author and do not in any way represent the views or opinions of any other person or entity.
Is the market’s next surge already underway? Find out with Tom Bowley’s breakdown of where the money is flowing now and how you can get in front of it.
In this video, Tom covers key moves in the major indexes, revealing strength in transports, small caps, and home construction. He identifies industry rotation signals, which are pointing to aluminum, recreational products, and furnishings. Tom then demonstrates how to use StockCharts’ tools to scan for momentum stocks in emerging leadership groups — see why SGI tops Tom’s list. He ends with a discussion of post-earnings reactions from major names like GOOGL, TSLA, IBM, and LVS.
And, of course, Tom wraps every idea with clear chart setups you can act on today.
This video premiered on July 24, 2025. Click this link to watch on Tom’s dedicated page.
Missed a session? Archived videos from Tom are available at this link.
The S&P 500 ($SPX) just logged its fifth straight trading box breakout, which means that, of the five trading ranges the index has experienced since the April lows, all have been resolved to the upside.
How much longer can this last? That’s been the biggest question since the massive April 9 rally. Instead of assuming the market is due to roll over, it’s been more productive to track price action and watch for potential changes along the way. So far, drawdowns have been minimal, and breakouts keep occurring. Nothing in the price action hints at a lasting change — yet.
While some are calling this rally “historic,” we have a recent precedent. Recall that from late 2023 through early 2024, the index had a strong start and gave way to a consistent, steady trend.
From late October 2023 through March 2024, the S&P 500 logged seven consecutive trading box breakouts. That streak finally paused with a pullback from late March to early April, which, as we now know, was only a temporary hiccup. Once the bid returned, the S&P 500 went right back to carving new boxes and climbing higher.
New 52-Week Highs Finally Picking Up
If there’s been one gripe about this rally, it’s that the number of new highs within the index has lagged. As we’ve discussed before, among all the internal breadth indicators available, new highs almost always lag — that’s normal. What we really want to see is whether the number of new highs begins to exceed prior peaks as the market continues to rise, which it has, as shown by the blue line in the chart below.
As of Wednesday’s close, 100 S&P 500 stocks were either at new 52-week highs or within 3% of them. That’s a strong base. We expect this number to continue rising as the market climbs, especially if positive earnings reactions persist across sectors.
Even when we get that first day with 100+ S&P 500 stocks making new 52-week highs, though, it might not be the best time to initiate new longs.
The above chart shows that much needs to align for that many stocks to peak in unison, which has historically led to at least a short-term consolidation, if not deeper pullbacks — as highlighted in yellow. Every time is different, of course, but this is something to keep an eye on in the coming weeks.
Trend Check: GoNoGo Still “Go”
The GoNoGo Trend remains in bullish mode, with the recent countertrend signals having yet to trigger a greater pullback.
Active Bullish Patterns
We still have two live bullish upside targets of 6,555 and 6,745, which could be with us for a while going forward. For the S&P 500 to get there, it will need to form new, smaller versions of the trading boxes.
Failed Bearish Patterns
In the chart below, you can view a rising wedge pattern on the recent price action, the third since April. The prior two wedges broke down briefly and did not lead to a major downturn. The largest pullbacks in each case occurred after the S&P 500 dipped below the lower trendline of the pattern.
The deepest drawdown so far is 3.5%, which is not exactly a game-changer. Without downside follow-through, a classic bearish pattern simply can’t be formed, let alone be broken down from.
We’ll continue to monitor these formations as they develop because, at some point, that will change.
Here are some charts that reflect our areas of focus this week at
XLU Leads with New High
Even though the Utilities SPDR (XLU) cannot keep pace with the Technology SPDR (XLK) and Communication Services SPDR (XLC), it is in a leading uptrend. XLU formed a cup-with-handle from November to July and broke to new highs the last two weeks. ETFs hitting new highs are in strong uptrends and should be on our radar.
Metal Mania in 2025
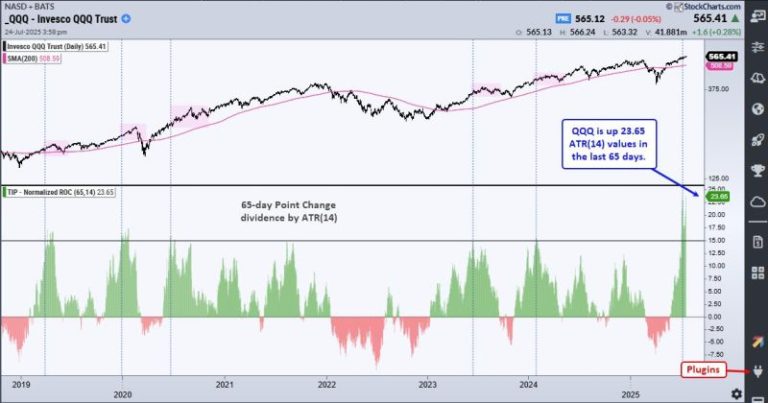
In a tribute to Ozzy, metals are leading the way higher in 2025. The PerfChart below shows year-to-date performance for the continuous futures for 12 commodities. Copper, Platinum and Palladium are up more than 45% year-to-date, while Gold is up 28.38% and Silver is up 35.30%. QQQ is up 10.52% year-to-date, but lagging these metals. The other commodities are mixed.
Multi-Year Highs for Silver and Copper
The next chart shows 11 year bar charts for five metals. Gold broke out in early 2024 and led the metals move with an advance the last 21 months. Silver and copper broke out to multi-year highs. Platinum broke above its 2021 high and Palladium got in the action with an 18 month high. There is a clear message here: metals are moving higher and leading as a group.
Home Construction Hits Moment of Truth
The Home Construction ETF (ITB) hit its moment of truth as it rose to its falling 40-week SMA. Notice that ITB failed just below this moving average in August 2023. During the 2023-2024 uptrend, the 40-week SMA was more friendly as ITB reversed near this level in October 2023 and June 2024. ITB surged to the falling 40-week SMA in July, but the long-term trend is down and this area could be its nemesis.
Google has eliminated more than one-third of its managers overseeing small teams, an executive told employees last week, as the company continues its focus on efficiencies across the organization.
“Right now, we have 35% fewer managers, with fewer direct reports” than at this time a year ago, said Brian Welle, vice president of people analytics and performance, according to audio of an all-hands meeting reviewed by CNBC. “So a lot of fast progress there.”
At the meeting, employees asked Welle and other executives about job security, “internal barriers” and Google’s culture after several recent rounds of layoffs, buyouts and reorganizations.
Welle said the idea is to reduce bureaucracy and run the company more efficiently.
“When we look across our entire leadership population, that’s mangers, directors and VPs, we want them to be a smaller percentage of our overall workforce over time,” he said.
The 35% reduction refers to the number of managers who oversee fewer than three people, according to a person familiar with the matter. Many of those managers stayed with the company as individual contributors, said the person, who asked not to be named because the details are private.
Google CEO Sundar Pichai weighed in at the meeting, reiterating the need for the company “to be more efficient as we scale up so we don’t solve everything with headcount.”
Google eliminated about 6% of its workforce in 2023, and has implemented cuts in various divisions since then. Alphabet finance chief Anat Ashkenazi, who joined the company last year, said in October that she would push cost cuts “a little further.” Google has offered buyouts to employees since January, and the company has slowed hiring, asking employees to do more with less.
Regarding the buyouts, executives at the town hall said that a total of 10 product areas have presented “Voluntary Exit Program” offers. They’ve applied to U.S.-based employees in search, marketing, hardware and people operations teams this year.
Fiona Cicconi, Google’s chief people officer, said at last week’s meeting that between 3% and 5% of employees on those teams have accepted the buyouts.
“This has been actually quite successful,” she said, adding “I think we can continue it.”
Pichai said the company executed the voluntary buyouts after listening to employees, who said they preferred that route to blanket layoffs.
“It’s a lot of work that’s gone into implementing the VEP program, and I’m glad we’ve done it,” Pichai said. “It gives people agency, and I’m glad to see it’s worked out well.”
Cicconi said one of the main reasons employees are taking the buyouts is because they want to take time off from work.
“It’s actually quite interesting to see who’s taking a VEP, and it’s people sort of wanting a career break, sometimes to take care of family members,” she said.
CNBC previously reported that the layoffs hurt morale as the company was downsizing while at the same time issuing blowout earnings and seeing its stock price jump. Alphabet’s shares are up 10% this year after climbing 36% in 2024 and 58% the year prior.
At another point in the town hall, employees asked if Google would consider a policy similar to Meta’s “recharge,” a month-long sabbatical that employees earn after five years at the company.
“We have a lot of leaves, not least our vacation, which is there for exactly that — resting and recharging,” said Alexandra Maddison, Google’s senior director of benefits.
She said the company is not going to offer paid sabbatical.
“We’re very confident that our current offering is competitive,” Maddison said.
Meta didn’t immediately respond to a request for comment.
Other executives jumped in to compare the two companies’ benefits.
“I don’t think they have a VEP at Meta by the way,” Cicconi said.
Pichai then asked, to some laughs from the audience, “Should we incorporate all policies of Meta while we’re at it? Or should we only pick and choose the few policies we like?”
“Maybe I should try running the company with all of Meta’s policies,” he continued. “No, probably not.”
Flowers, succulents and Formula One race cars helped fuel a 12% revenue bump for Lego during the first half of the year.
The company reported a record 34.6 billion Danish kroner, or $5.4 billion, in revenue as part of its biannual earnings report on Wednesday. Operating profit rose 10% year over year to 9 billion Danish kroner, or $1.4 billion, the company said.
“It’s the best first half ever,” Lego CEO Niels Christiansen told CNBC. “It’s a record on revenue, a record on operating profit, it’s a record on net profit. … So, we are very happy.”
The brick maker launched 314 new sets during the first six months of the year, another record high. Lego has steadily added new product to its portfolio, branching out into home decor with wall art sets. It has also added new license partners and released sets tied to animated children’s program “Bluey” and fan-favorite anime “One Piece.”
Up next is a multiyear partnership with Pokemon, due to hit shelves in 2026.
“You can always find something that you really like, the pop culture you’re into or the passion point you have,” Christiansen said. “That works really well.”
In expanding its catalog of product, Lego has also grown its consumer base. Gateways into the brand such as its line of botanicals — plants, flower bouquets and succulents — and its ongoing partnership with Epic Games — which brings Lego to the digital space and elements from the popular video game Fortnite into the physical world — have encouraged newcomers into the brick-building space, Christiansen said.
“Then they figure out what it is and what it does for them, how it kind of allows them to express themselves, but also de-stress and focus on stuff in a different way,” he said. “So botanicals sets turn out to be good at recruiting new consumers into the brand, and then as soon as they build their botanical set, they may move on to building something else.”
Lego opened 24 new stores globally during the first six months of the year. The company has been opening more physical retail locations in areas that, unlike the U.K. and the U.S., did not grow up with the iconic colored bricks. This includes countries such as China and India.
Having brick-and-mortar places where kids and adults can get their hands on Legos and see the available sets has previously helped bolster sales.
THE SANTA ROSA PLATEAU ECOLOGICAL RESERVE, Calif. — The scientist traipses to a pond wearing rubber boots but he doesn’t enter the water. Instead, Brad Hollingsworth squats next to its swampy edge and retrieves a recording device the size of a deck of cards. He then opens it up and removes a tiny memory card containing 18 hours of sound.
Back at his office at the San Diego Natural History Museum, the herpetologist — an expert in reptiles and amphibians — uses artificial intelligence to analyze the data on the card. Within three minutes, he knows a host of animals visit the pond — where native red-legged frogs were reintroduced after largely disappearing in Southern California. There were owl hoots, woodpecker pecks, coyote howls and tree frog ribbits. But no croaking from the invasive bullfrog, which has decimated the native red-legged frog population over the past century.
It was another good day in his efforts to increase the population of the red-legged frog and restore an ecosystem spanning the U.S.-Mexico border. The efforts come as the Trump administration builds more walls along the border, raising concerns about the impact on wildlife.
At 2 to 5 inches long, red-legged frogs are the largest native frogs in the West and once were found in abundance up and down the California coast and into Baja California in Mexico.
The species is widely believed to be the star of Mark Twain’s 1865 short story, “The Celebrated Jumping Frog of Calaveras County,” and their crimson hind legs were eaten during the Gold Rush. But as the red-legged frog declined in numbers, the bullfrog — with its even bigger hind legs — was introduced to menus during California’s booming growth in the late 19th and early 20th centuries.
AP correspondent Ed Donahue reports on an international effort to bring back a type of frog.
The red-legged frog population was decimated by the insatiable appetite of the bullfrogs and the disease the non-native species brought in, but also because it lost much of its habitat to drought and human development in the shape of homes, dams and more.
Hollingsworth couldn’t estimate the number of red-legged frogs that remain but said they have disappeared from 95% of their historical range in Southern California.
Brad Hollingsworth records an image of a red-legged froglet in a restoration pond on Aug. 11, on a ranch outside of El Coyote, Mexico.Gregory Bull / AP
Robert Fisher of the U.S. Geological Survey’s Amphibian Research and Monitoring Initiative Program searched for the frog for decades across 250 miles from Los Angeles to the border. He found just one in 2001 and none after that.
Scientists using DNA from red-legged frogs captured in Southern California before their disappearance discovered they were more genetically similar to the population in Mexico than any still in California.
In 2006, Fisher, Hollingsworth and others visited Baja where they had heard of a small population of red-legged frogs. Anny Peralta, then a student of Hollingsworth at San Diego State University, joined them. They found about 20 frogs, and Peralta was inspired to dedicate her life to their recovery.
Peralta and her husband established the nonprofit Fauna del Noroeste in Ensenada, Mexico, which aims to promote the proper management of natural resources. In 2018, they started building ponds in Mexico to boost the frog population that would later provide eggs to repopulate the species across the border.
But just as they were preparing to relocate the egg masses, the COVID-19 pandemic hit. Peralta and the U.S. scientists scrambled to secure permits for the unusual cargo and a pilot to fly the two coolers of eggs closer to the border. The rest of their journey north was by road, after the eggs passed a U.S. border guard inspection.
Over the past five years, Hollingsworth and his team have searched for sounds to prove their efforts to repopulate ponds in Southern California worked.
On Jan. 30, he heard the quiet, distinct grunting of the red-legged frog’s breeding call in an audio flagged by AI.
“It felt like a big burden off my shoulder because we were thinking the project might be failing,” Hollingsworth said. “And then the next couple nights we started hearing more and more and more, and more, and more.”
Over the next two months, two males were heard belting it out on microphone 11 at one of the ponds. In March, right below the microphone, the first egg masse was found, showing they had not only hatched from the eggs brought from Mexico but had gone on to produce their own eggs in the United States.
Conservationists are increasingly turning to artificial intelligence to monitor animals on the brink of extinction, track the breeding of reintroduced species and collect data on the impact of climate change and other threats.
Herpetologists are building on the AI-powered tools already used to analyze datasets of bird sounds, hoping that it might help build audio landscapes to identify amphibians and track their behavior and breeding patterns, said Zachary Principe of The Nature Conservancy, which is working with the museum on the red-legged frog project. The tools could also help scientists analyze tens of thousands of audio files collected at universities, museums and other institutions.
Scientists working to restore the red-legged frog population in Southern California hope to soon be provided with satellite technology that will send audio recordings to their phones in real time, so they can act immediately if any predators — in particular bullfrogs — are detected.
Herpetologist Bennet Hardy holds a leaping red-legged froglet in a restoration pond on a ranch outside of El Coyote, Mexico.Gregory Bull / AP
It could also help track the movement of the frogs, which can be difficult to find in the wild, especially because cold-blooded creatures cannot be detected using thermal imagery.
The AI analysis of the pond audio has saved time for Hollingsworth and the others, who previously had to painstakingly listen to countless hours of audio files to detect the calls of the red-legged frog — which resembles the sound of a thumb being rubbed on a balloon — over the cacophony of other animals.
“There’s tree frogs calling, there’s cows mooing, a road nearby with a motorcycle zooming back and forth,” Hollingsworth said of the ponds’ audio landscape. “There’s owls, there’s ducks splashing, just all this noise”
The red-legged frog is the latest species to see success from binational cooperation along the near-2,000-mile border spanning California, Arizona, New Mexico and Texas. Over the years, Mexican gray wolves have returned to their historic range in the southwestern U.S. and in Mexico, while the California Condor now soars over skies from Baja to Northern California.
Based off the latest count, scientists estimate more than 100 adult red-legged frogs are in the Southern California ponds, and tadpoles were spotted at a new site.
The team plans to continue transporting egg masses from Baja, where the population has jumped from 20 to as many as 400 adult frogs, with the hope of building thriving populations on both sides of the border. Already the sites are seeing fewer mosquitos that can carry diseases like dengue and Zika.
A restoration pond in Baja that Peralta’s organization built recently teemed with froglets, their tiny eyes bobbing on its aquatic fern-covered surface. They could, one day, lay eggs for relocation to the U.S.
“They don’t know about borders or visas or passports,” Peralta said of the frogs. “This is just their habitat, and these populations need to reconnect. I think this shows that we can restore this ecosystem.”