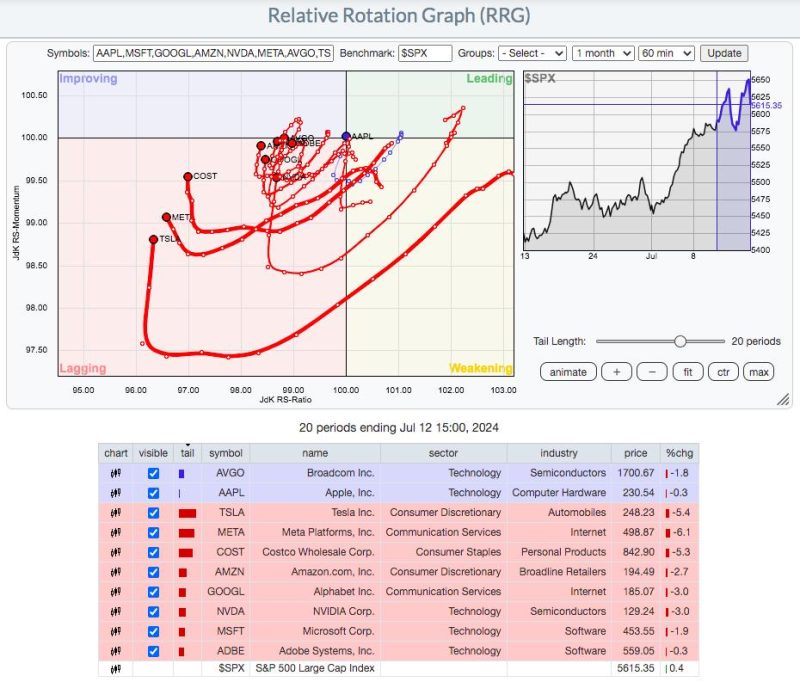
It was a very interesting week indeed. All-time high records continued to fall on a daily basis, but the complexion of the market most definitely changed during the latter part of the week. First, I want to pull up an hourly RRG chart to track 10 key growth stocks, most of which have carried the overall S&P 500 higher throughout 2024:
This chart is tracking the relative rotation of these 10 growth stocks (vs. the benchmark S&P 500) over the last 20 periods, or roughly 3 days. Many of these stocks started their 3-day journey on the right side of this chart, which highlights tremendous relative strength at that time. But look where they finished on Friday. Not one of these 10 stocks finished in the leading quadrant. Not one. AAPL held up best, but TSLA, META, and COST tumbled to close out the week. That type of behavior among these growth juggernauts would likely send you to the conclusion that we had 3 really bad days in the market. Instead, look at how the S&P 500 performed over the past 3 days from this hourly chart:
So what happened? How did the S&P 500 hold up when its most-heavily-weighted stocks fell so quickly?
Rotation. Bullish rotation. This is what sustains bull markets. Even the biggest and best leaders fall from time to time. But does the money leave the stock market or does it simply rotate and drive prices higher elsewhere. Well, last week it was the latter. Let’s check out large-cap growth (IWF) and large-cap value (IWD) and then the 11 sectors on that same 20-period RRG chart:
IWF:IWD
Sectors
In this case, two pictures say two thousand words.
Could the relative performance of the IWF and IWD have shown more disparity over the past few days than they did? Growth was tossed out the window, while traders suddenly fell in love with value stocks. I believe the June CPI report was the primary trigger for this rotation. I viewed it as a “sell on news” for growth stocks after months of “buying on rumor”. I also view it as “warning shots fired” towards Fed Chief Powell and his band of hawks. This report was an absolute DAGGER for those Fed officials that believe we should remain on the current “higher rates for longer” bandwagon. Check out the latest chart on core inflation at the consumer level:
The 1-month and 12-month rate of change (ROC) have rapidly declined. I swear I think the Fed is looking at a different chart, or maybe someone needs to turn their computers right side up. They’ve made it clear that they want sustainability towards their 2% target level. It sure seems to me that monthly Core CPI is back in the normal range and has been moving sustainably towards 2% for at least the last year. Yet the Fed keeps waiting, even talking about the possibility of another hike. Personally, I’m sick of this Fed. As I said, warning shots have been fired over the past few weeks. The bond market is SCREAMING at the Fed to lower rates. And growth stocks have just had their second bout of significant selling. We’re teetering folks.
I’ve been steadfastly bullish throughout this secular bull market, suggesting to everyone to avoid all the noise about crashes and collapses. I am, however, growing worried about the Fed’s handling of monetary policy. There are already economic signals that are telling me the cracks in our economic foundation are growing and spreading and that hopes of a “soft landing” are dwindling. If this isn’t stopped SOON, it’ll be too late, and we could be staring at a SIGNIFICANT market meltdown in the weeks and months ahead.
On Saturday, July 27th at 10:00am ET, I will be hosting an extremely important event, “The Fed and The Presidential Election Cycle: Why the S&P 500 May Tumble”. This event is FREE, but you must register and capacity is limited. If you want to consider ways to protect your capital, then I am urging you to sign up EARLY. For more information and to register, CLICK HERE.
Happy trading!
Tom

